![]()
I decided to create own monitoring system to keep updated about some important climate parameters. For me, it were:
- temperature
- humidity
- co2
It should be flexible, it should be easy to add a new metric or create/edit alert if something goes out of limits.
Why do we need it?
Climate observing at home is important for everyone who lives there. Many times I found myself very exhausted even after 3-4 hours of work. I remember it happened in the office full of people, and I couldn’t open the window because it was too cold outside. Of course, a lot of reasons can lead to such fatigue, however when the window is open I usually more productive. Often CO2 is too high at winter when opening a window significantly reduces inside temperature and people prefer not to open it. The tricky thing is that a human notices excess CO2 only after several hours after it really happened. That is why it is more task of monitoring, because when you know the issue it can be solved easily.
The same is true for humidity. Winter heating can dramatically reduce humidity that causes discomfort and potential infections. The solution is to open window or switch a humidifier on.
It turns out that providing good room’s climate needs opening windows, so let’s control the temperature too. It is not a good option to forget opened window at night at winter in child’s room.
Implementation
To implement it I ordered several sets of following devices:
- board with ESP8266EX
- humidity&temperature sensor
- CO2 sensor
(per each room)
All of them were sold me by the same company that wraps them into same form factor, provides easy integration. So I didn’t have to solder wires. All I needed is to insert all sensors to the board and do programming.
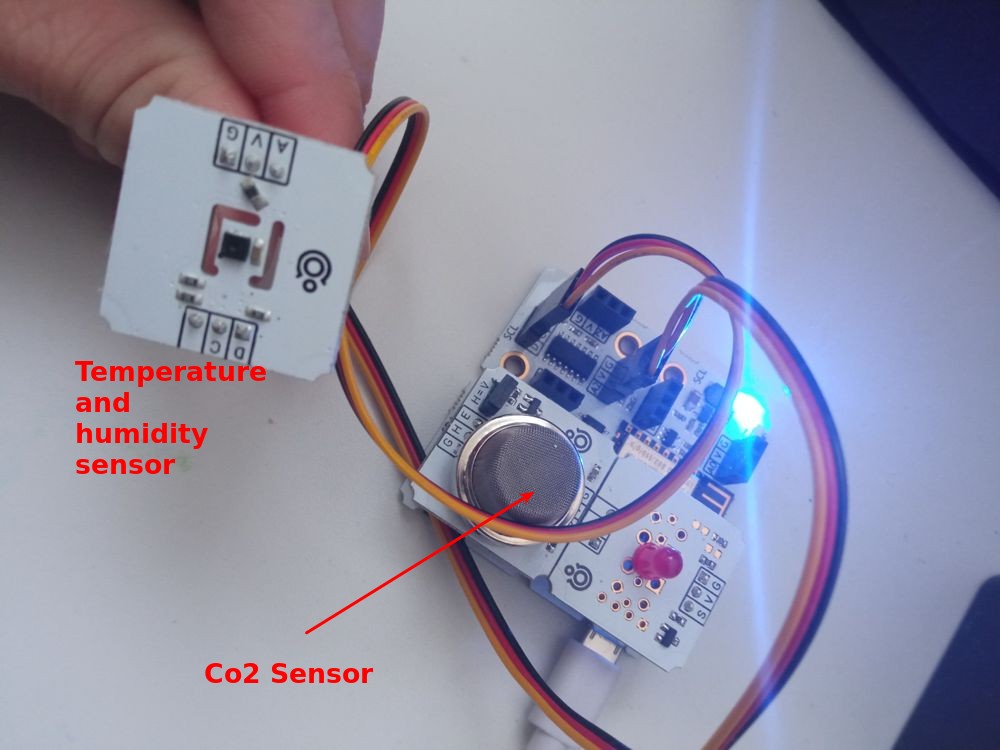
It is important to know that CO2 sensor needs internal heating to measure CO2 level, that is why I have to place it separately from temperature&humidity sensor. I have temperature&humidity sensor connected via wires and CO2 sensor directly connected to the board. Also, I have the LED - it used just for tests & debug purposes.
And here is how it works as whole system:
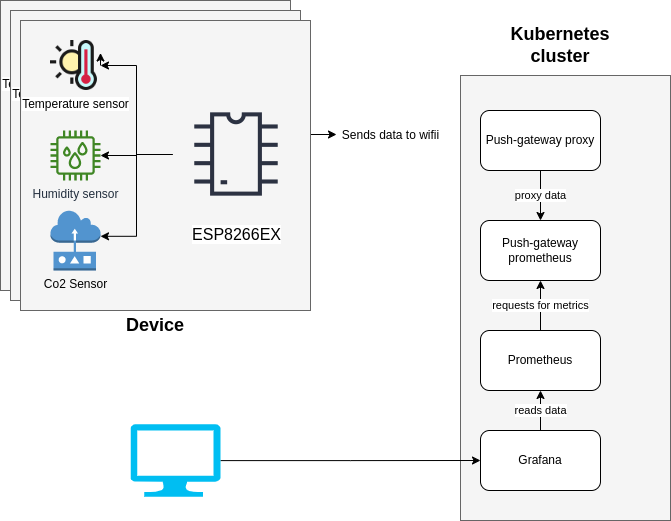
The devices send data to “Push-gateway proxy” microservice. Here is the code example which used for sending data to server. So I read values from sensors periodically and send them with this function.
    void _sendDataToServer(float temperatureC, float humidity, float co2Ppm, float co2Ro, float co2Ratio) {
        Serial.println("Starting connection to server...");
        if (client.connect(server, 80)) {
            Serial.println("Connected to server. Sending data...");
            client.println("GET /metrics/job/climate_job/instance/test_room?metric_temperature=" + String(temperatureC)
              + "&metric_humidity=" + String(humidity)
              + "&metric_co2=" + String(co2Ppm)
              + "&metric_co2Ro=" + String(co2Ro)
              + "&metric_co2Ratio=" + String(co2Ratio)
              + " HTTP/1.1");
            client.println("Host: push-gateway-proxy.kosbr.ru");
            client.println("Authorization: Basic authorizationKey");
            client.println("User-Agent: curl/7.58.0");
            client.println("Accept: */*");
            client.println();
            Serial.println("Data is sent to the server. Response is ignored in current version of app (not 100% it was 200-OK)");
        } else {
            Serial.println("Error happened while connecting to server");
        }
    }
The microservice “Push-gateway proxy” receives data and sends it to Push-gateway prometheus. By design prometheus should call services itself and collect metrics, however this is not always possible, that is why Push-gateway has been created. Unfortunately, I didn’t manage to send metrics from the board to Push-gateway, so I created a simple nodejs proxy that changes format of input data and sends it directly to Push gateway. Prometheus itself requests Push-gateway, receives metrics and keep it. Grafana is just a convenient client to prometheus.
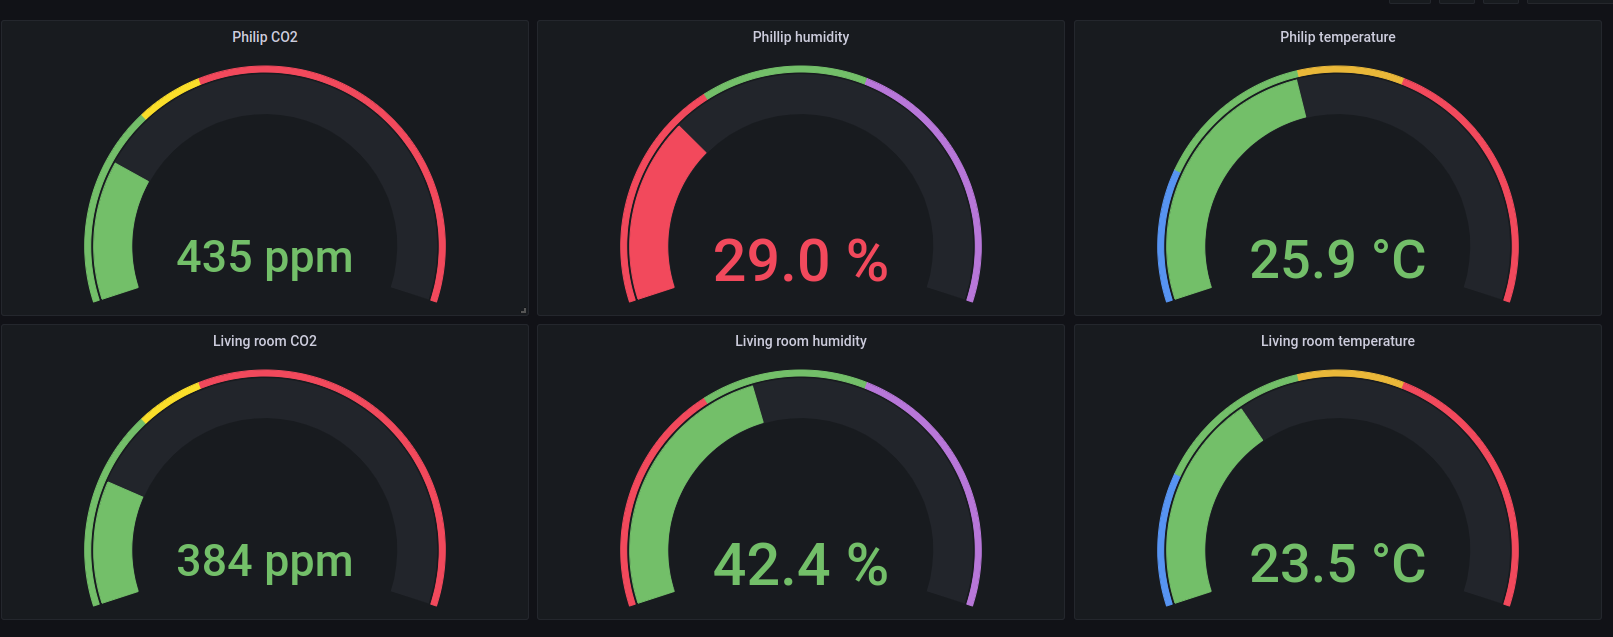
Usages
At the end I have monitoring dashboard like this. It is colored, so I visualized values with color. For example, here I see that humidity in one room is too low, I’m notified about it via telegram (grafana can do it). I definitely should switch on the humidifier.
I can create any diagram I have in miy mind. It is very interesting to observe values during some time. For example, here heating was reduced:
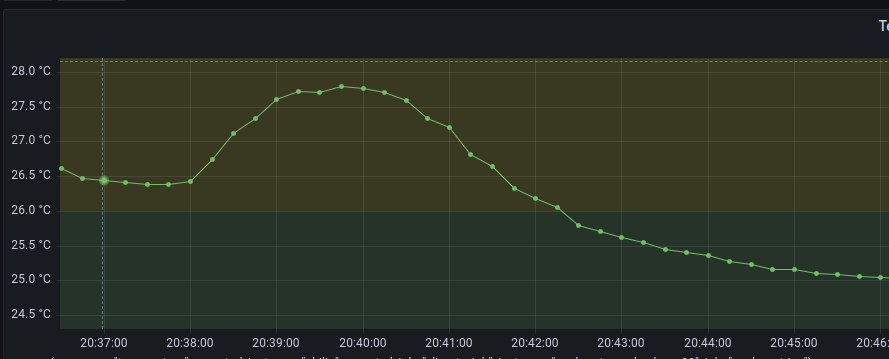
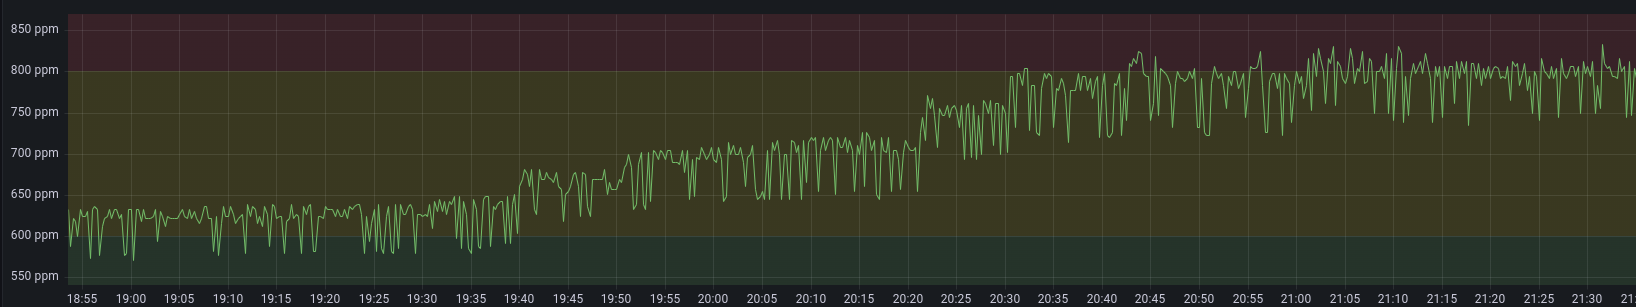
And here is CO2 trap. You see how it slowly raises. Better to get some fresh air:
Issues
CO2 sensor calibration
CO2 sensor doesn’t work out of box. It changes its resistance depending on CO2 concentration, but I must define its resistance in fresh air conditions. This is called calibration. I tried to do it many times, but I wasn’t satisfied by result. It costed many attempts and ideas to get the measurements almost trustable, however I still not sure that they are right in absolute, but relatively I can detect when my room need to be ventilated.
CO2 sensor energy consumption
CO2 sensors consumes quite a lot of energy due too heating, so I can’t put my devices anywhere I want, it must be close to a socket. Alternatively I can reduce the period of CO2 metric, for example I can do it once in hour. But I should keep in mind that CO2 must be heated couple minutes before measuring.
CO2 false alert
When CO2 sensor is cold it gets unreal big values of CO2 concentration. As a consequence, I get false alerts when I switch my device on. Ideally I should have improved that not sending CO2 metric when it is cold.